This task can be performed using Graphium
Turn Excel & PowerPoint charts into branded, publication-ready visuals
Best product for this task

Graphium
productivity
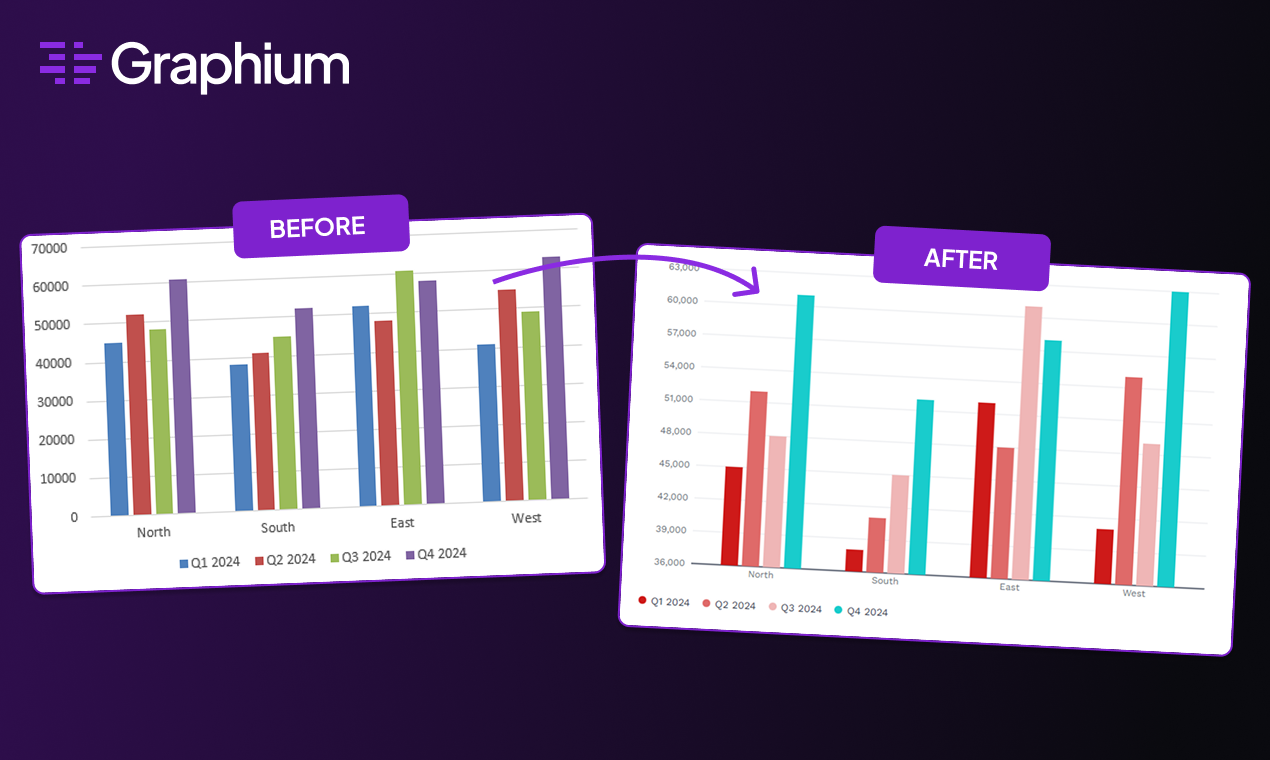
Graphium takes your ugly Excel and PowerPoint charts and reformats them into clean, publication-ready visuals with consistent brand styling, in seconds.
What to expect from an ideal product
- Graphium connects directly to your existing PowerPoint files and rebuilds charts to match your brand fonts, colors, and spacing automatically.
- No design skills needed: paste your chart, pick your brand preset, and export a clean visual ready for reports, decks, or publications in seconds.
- Teams stop wasting hours in Illustrator fixing axis labels and mismatched colors every time a data update comes in.
- Graphium handles bar charts, line graphs, scatter plots, and more, so you get consistent styling across every chart type in one workflow.
- Finance, research, and marketing teams use Graphium to ship polished client-ready visuals without going back and forth with a designer.