This task can be performed using Graphium
Turn Excel & PowerPoint charts into branded, publication-ready visuals
Best product for this task
Graphium
productivity
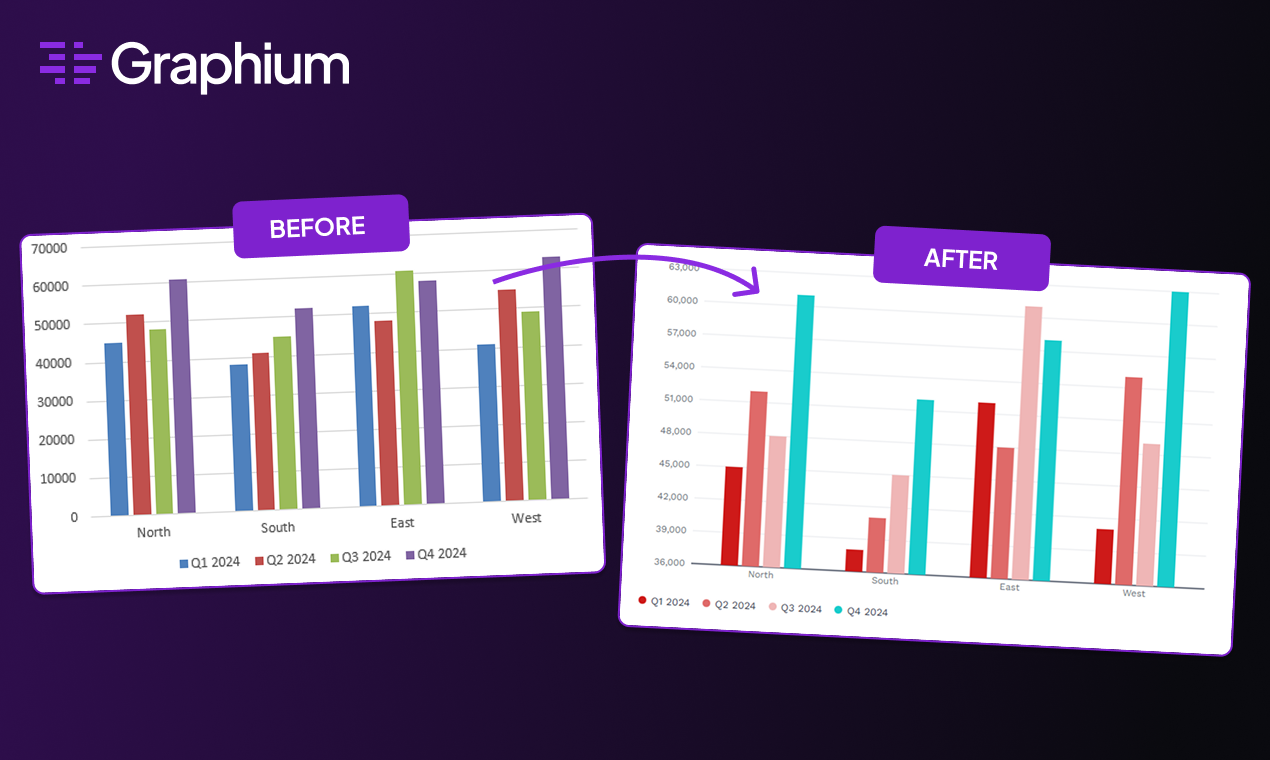
Graphium takes your ugly Excel and PowerPoint charts and reformats them into clean, publication-ready visuals with consistent brand styling, in seconds.
What to expect from an ideal product
- Import your messy Excel charts directly into Graphium and watch them get cleaned up automatically with proper fonts, colors, and spacing
- Apply your company's brand colors, logos, and styling rules to all charts at once instead of fixing each one manually
- Fix common chart problems like cluttered legends, poor color choices, and unreadable text with one-click solutions
- Export polished charts in high-resolution formats ready for reports, presentations, or websites without any additional editing
- Save hours of manual formatting work by using pre-built templates that instantly transform basic spreadsheet graphs into professional visuals
