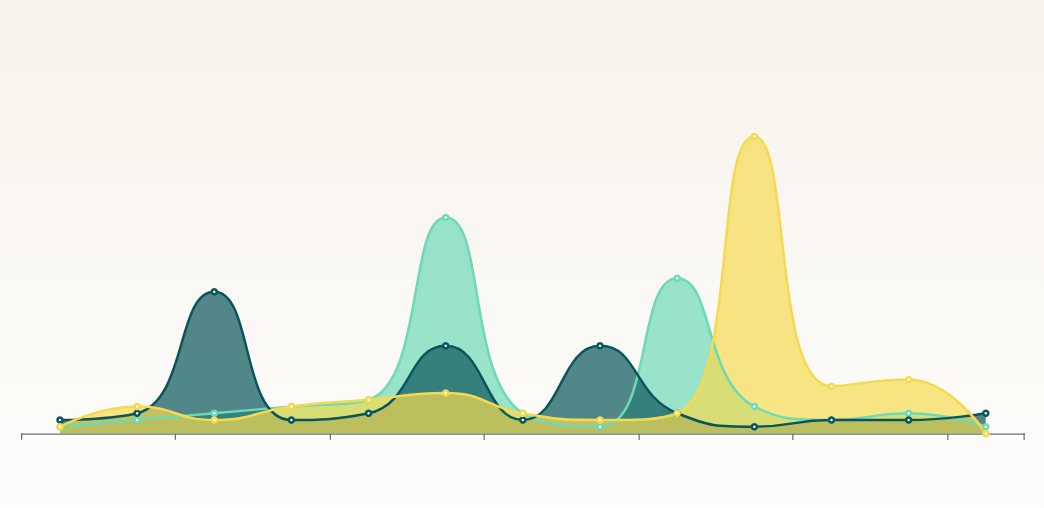
This task can be performed using Vizblock
Create Stunning Charts Easily with Vizblock
Best product for this task
Vizblock
blogging-platform
Powerful Gutenberg Block plugin to design beautiful, interactive charts directly in WordPress.

What to expect from an ideal product
- Drag and drop chart elements right in the WordPress editor, no code needed
- Pick from ready-made chart templates to get started quickly
- Change colors, fonts and styles with simple clicks
- Update chart data by typing numbers into a familiar spreadsheet view
- Preview your charts live as you make changes in the WordPress block editor
