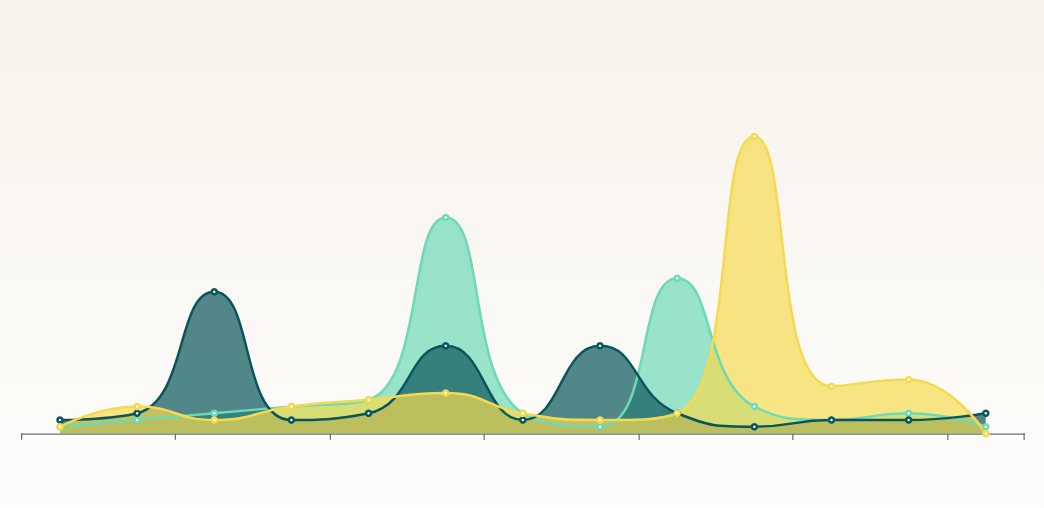
This task can be performed using Vizblock
Create Stunning Charts Easily with Vizblock
Best product for this task
Vizblock
blogging-platform
Powerful Gutenberg Block plugin to design beautiful, interactive charts directly in WordPress.

What to expect from an ideal product
- Drag and drop the Vizblock chart element into any Gutenberg post or page
- Pick from multiple chart types like bar, pie, or line graphs
- Input your data directly in the block editor using a simple spreadsheet view
- Customize colors, fonts, and animations to match your website's style
- Preview and adjust your charts in real-time before publishing
