This task can be performed using Datastripes
Transform data into insights instantly.
Best product for this task
Datastripes
analytics
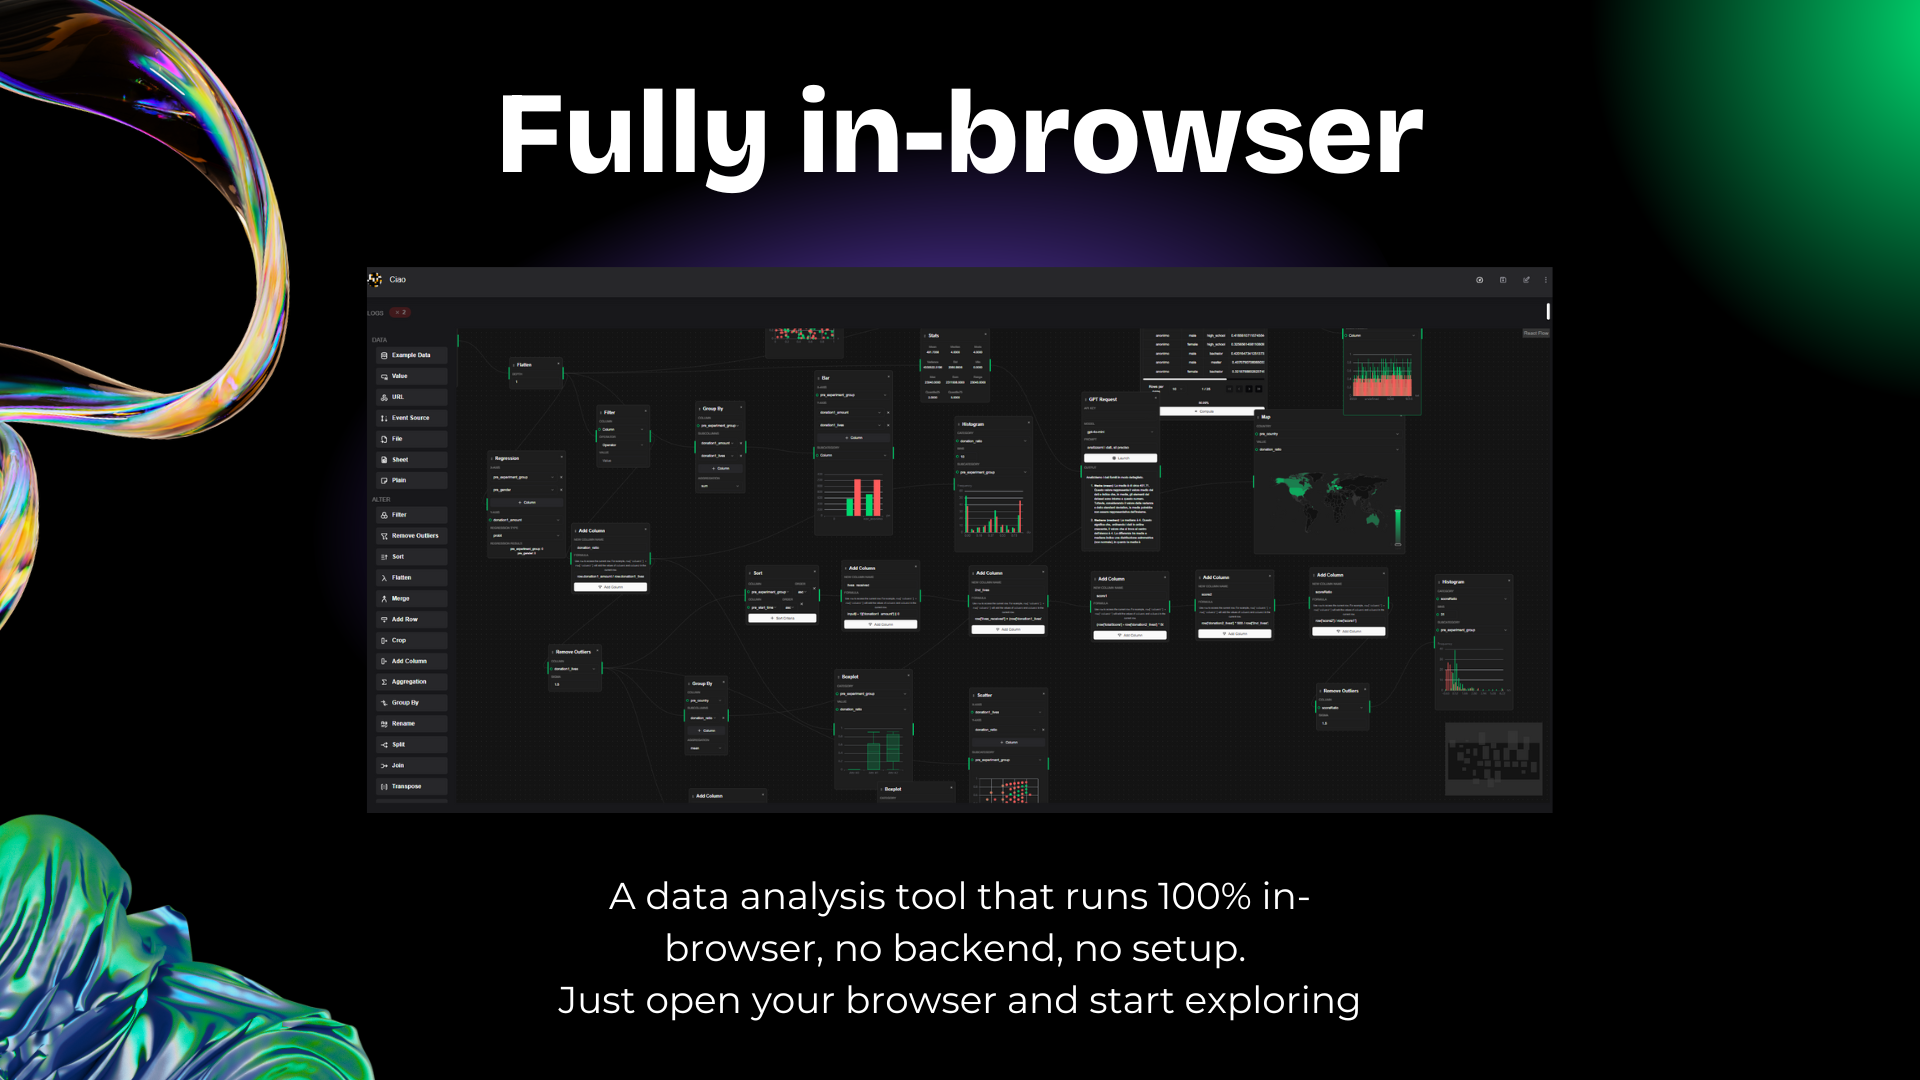
Datastripes is an innovative data visualization tool designed to transform your datasets into interactive and insightful visual flows. With a simple drag-and-drop interface, users can quickly generate dashboards, charts, reports, and complex data flows. Key features include the ability to create stunning dashboards, data flows, worst-case scenarios, charts, and heatmaps. The tool offers over 300 customizable nodes, including machine learning blocks and advanced visualizations such as maps and scatterplots, all running locally in your browser. Datastripes is ideal for project managers, data analysts, software houses, data engineers, and students, providing a flexible platform that supports coding in JavaScript and Python.
What to expect from an ideal product
- Upload your raw data files and instantly see them transformed into interactive charts and dashboards without any complex setup or coding knowledge required
- Use the drag-and-drop interface to quickly build custom data flows that reveal patterns and trends hiding in your datasets within minutes instead of hours
- Generate multiple visualization types from the same data source - from simple bar charts to complex heatmaps - helping you spot business opportunities from different angles
- Create what-if scenarios and worst-case analysis directly from your raw data to make confident business decisions backed by actual data insights
- Access over 300 ready-to-use visualization components that work instantly in your browser, eliminating the need for expensive software installations or IT department involvement
