This task can be performed using Datastripes
Transform data into insights instantly.
Best product for this task
Datastripes
analytics
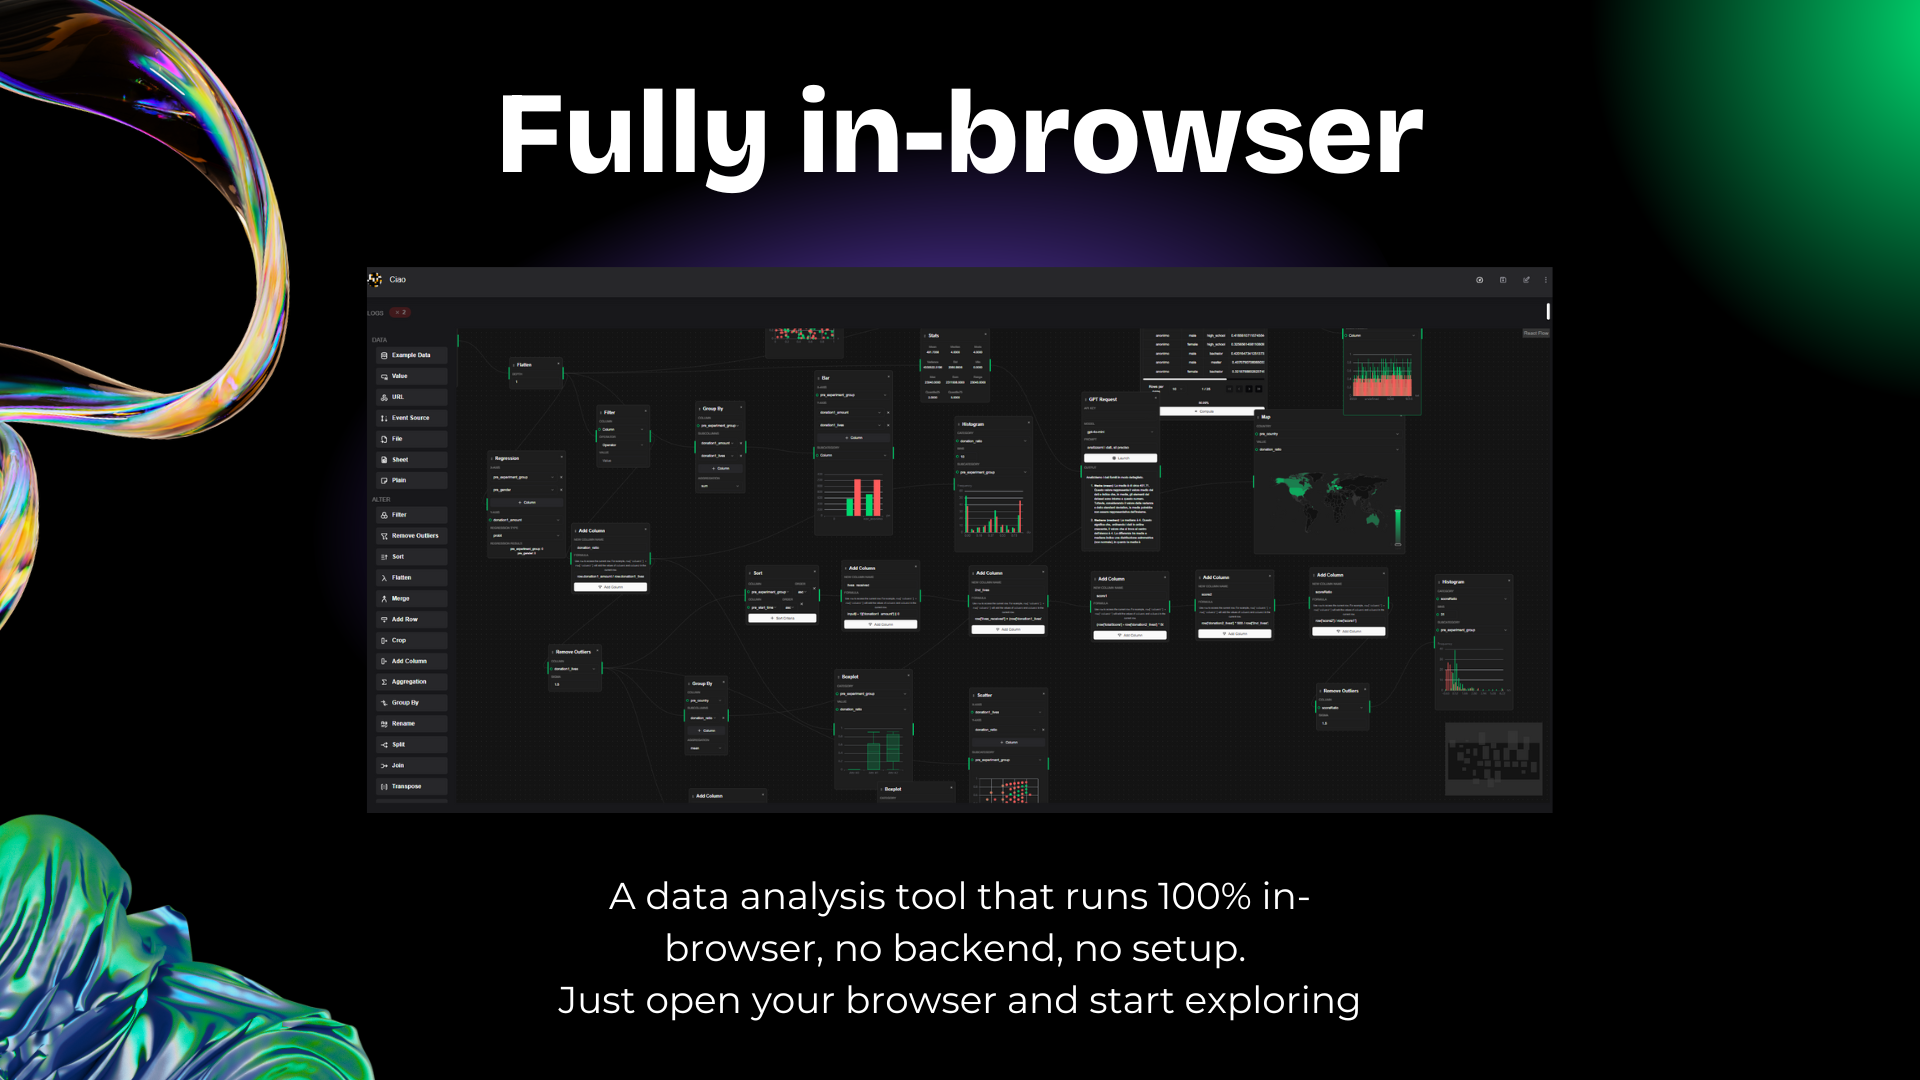
Datastripes is an innovative data visualization tool designed to transform your datasets into interactive and insightful visual flows. With a simple drag-and-drop interface, users can quickly generate dashboards, charts, reports, and complex data flows. Key features include the ability to create stunning dashboards, data flows, worst-case scenarios, charts, and heatmaps. The tool offers over 300 customizable nodes, including machine learning blocks and advanced visualizations such as maps and scatterplots, all running locally in your browser. Datastripes is ideal for project managers, data analysts, software houses, data engineers, and students, providing a flexible platform that supports coding in JavaScript and Python.
What to expect from an ideal product
- Drag-and-drop interface lets you build charts and dashboards by simply moving elements around instead of writing complex code
- Pre-built templates and over 300 ready-to-use components mean you can create professional visualizations by clicking and customizing existing blocks
- Real-time preview shows your data transforming into charts as you make changes, so you see results immediately without technical knowledge
- Built-in machine learning features automatically suggest the best chart types and data patterns without requiring programming skills
- Everything runs directly in your web browser, so there's no software to install or server setup needed to start creating interactive reports
