This task can be performed using Teemux
Teemux: Where teams sync faster, collaborate smarter, build better
Best product for this task
Teemux
mcp
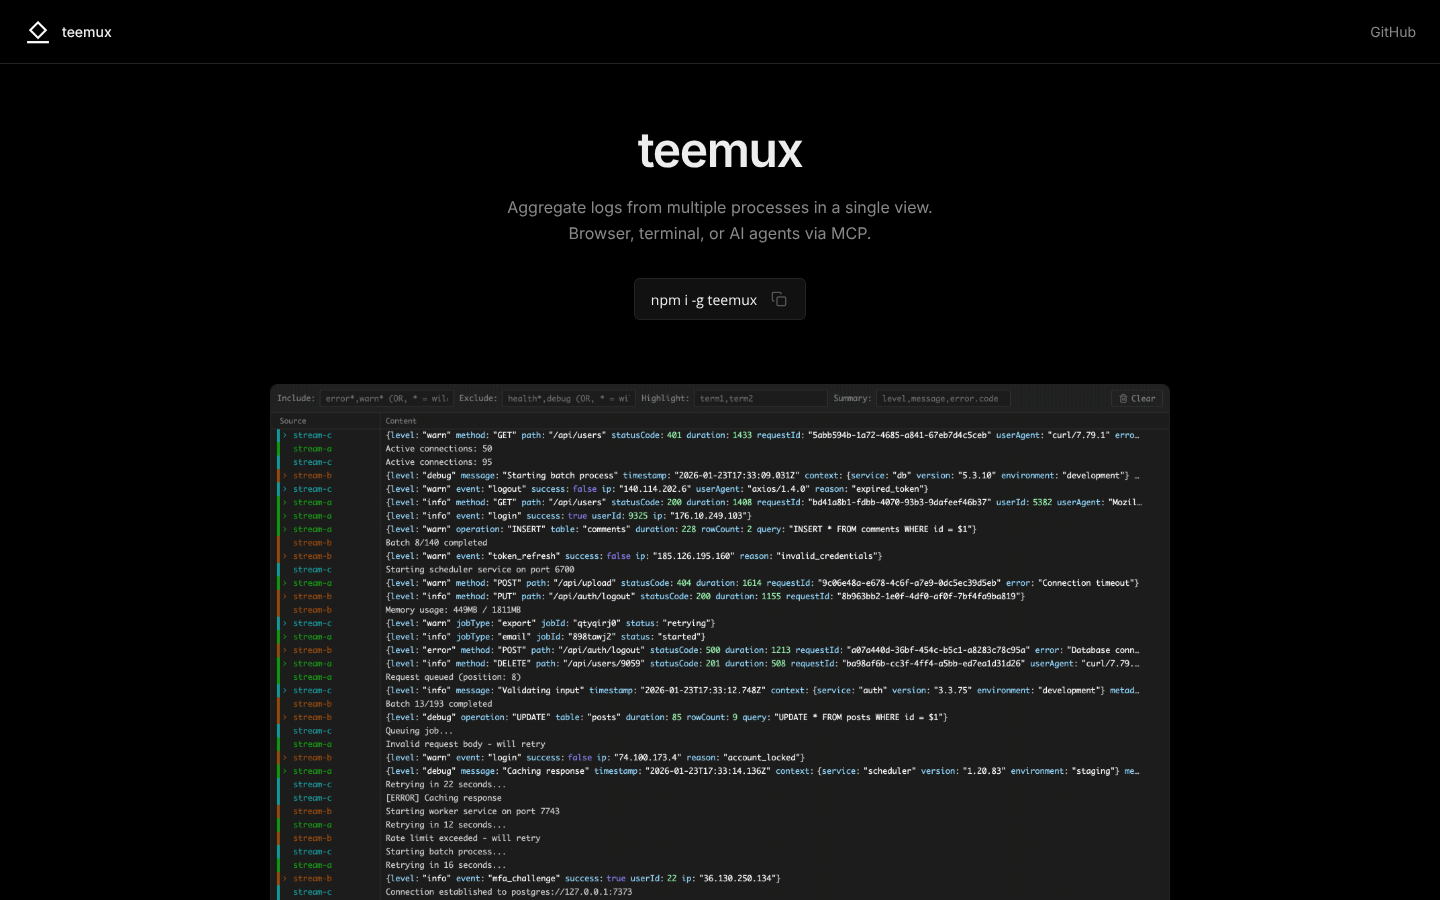
Teemux aggregates logs from multiple processes into one live, filterable view, accessible via browser, curl, or MCP. It enables persistent, AI-friendly log access without restarting services, simplifying multi-process debugging and monitoring.
What to expect from an ideal product
- Teemux pulls logs from all your running applications into one dashboard that updates instantly, so you don't need to jump between different terminals or log files
- You can filter and search through logs from multiple services at once using your web browser, making it easy to spot issues across your entire system
- The tool keeps your log history available even when you restart services, which means you won't lose important debugging information during deployments
- It works with curl commands and browser access, so your whole team can check logs without needing special tools or server access
- The live filtering lets you focus on specific applications or error types while still seeing the bigger picture of how all your services work together
