This task can be performed using Bklit UI
Build powerful charts faster with Bklit UI’s ready-made components
Best product for this task
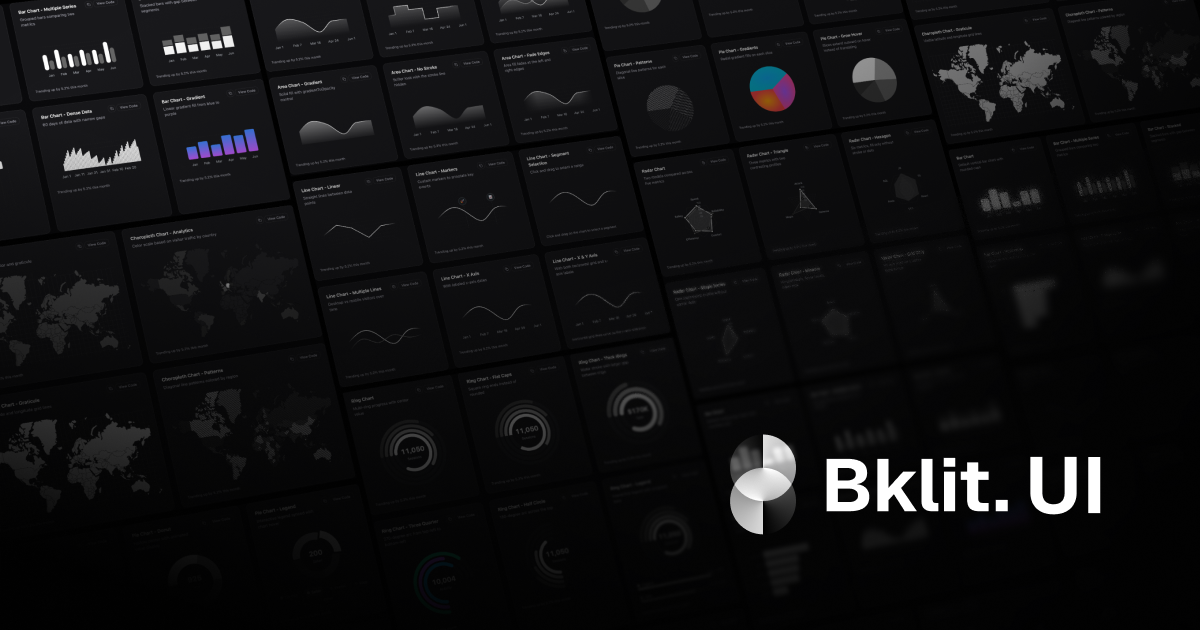
Bklit UI
ui-ux
Bklit UI is a pre-release component library that adds charting and data visualization elements to React projects using shadcn/ui. It helps developers quickly assemble consistent dashboards and analytics interfaces with reusable, theme-aligned components.
What to expect from an ideal product
- Provides pre-built chart components that automatically inherit your shadcn/ui color scheme and typography settings without manual configuration
- Includes responsive data visualization elements that match your existing design tokens, keeping dashboard layouts consistent across different screen sizes
- Offers drop-in React components for common charts like bar graphs, line charts, and pie charts that work seamlessly with shadcn/ui's theming approach
- Handles the complex integration between popular charting libraries and shadcn/ui's CSS variables, saving hours of custom styling work
- Ships with dark and light mode support built-in, so your charts automatically switch themes alongside the rest of your application interface
