This task can be performed using InstaCharts
Instantly create charts from spreadsheet files
Best product for this task
InstaCharts
analytics
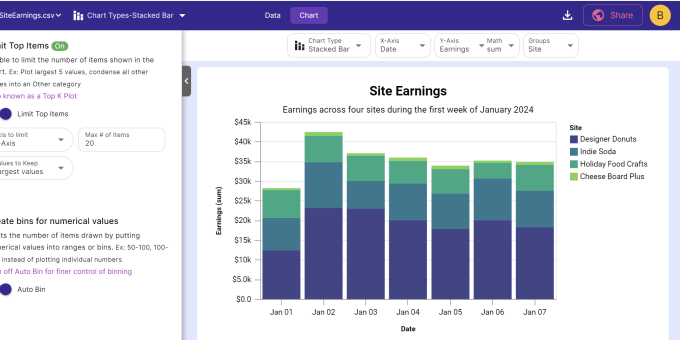
InstaCharts is a no code data exploration tool. Simply upload a spreadsheet and go! The software auto-detects column data types like dates, numbers, currencies, names and formatting. Recommended chart options are auto applied, saving you time setting up visualizations. Find something interesting? Easily share an interactive chart or data table with a teammate through a public link. Charts and data tables can also be embedded into webpages.
What to expect from an ideal product
- Automatically identifies column data types in uploaded spreadsheets
- Applies suitable chart types based on detected data
- Offers instant visualizations without manual setup
- Provides recommended chart options for different data types
- Streamlines the process of creating appropriate graphs for various data formats
