MAPOG Reviews — Discover what people think of this product.
MAPOG
Turn data into interactive maps and visual stories
- supporters
What does MAPOG help with?
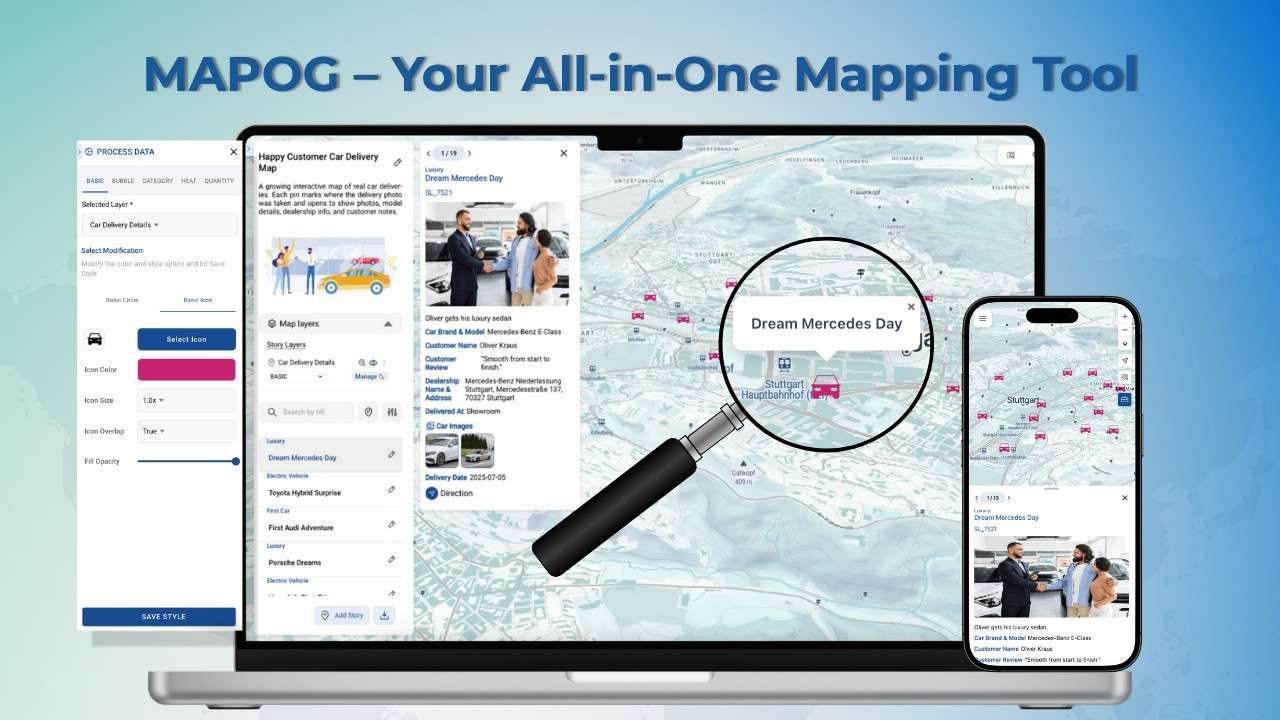
MAPOG is an AI-powered interactive mapping platform that helps users turn complex data into engaging, easy-to-understand visual maps. It’s designed for businesses, organizations, and individuals who deal with location-based information and want to make better, faster, and smarter decisions. With MAPOG, users can import data directly from CSV or Excel files and instantly visualize it on a map. Each point on the map can include photos, videos, links, and custom details, creating an interactive experience that goes beyond traditional spreadsheets or reports. This makes it ideal for professionals in real estate, travel, education, infrastructure, and logistics, among others. One of MAPOG’s standout features is its Point Library — a tool that allows users to save and reuse points across multiple maps. Once a point type (for example, hotel, site, or project) is created, it can be added to any new map with all its details intact, saving hours of repetitive work. MAPOG also supports geo-referencing, enabling users to add custom base maps such as property layouts, campus maps, or project blueprints aligned with real-world coordinates. Its Bearing Angle Measurement feature helps measure angles and directions between points, which is extremely useful in surveying, navigation, and project planning. For field operations, MAPOG makes Mobile Data Collection effortless. Field teams can capture, update, and sync data directly from their devices, reducing paperwork and improving accuracy. The platform also includes Task Management, which allows teams to assign, track, and monitor tasks linked to specific map points — ensuring better coordination and accountability. With the Live Location Sorting tool, field users can automatically see and sort nearby sites based on their current location — an excellent feature for route planning and maintenance visits. MAPOG also offers Layer and Filter Management, letting users categorize data by industry, project type, or status, and analyze it visually through color-coded layers. For data security and collaboration, MAPOG provides Role-Based Access Control where users can share maps with Editors, Contributors, or Viewers. Maps can be shared via public or private links and exported offline for reports or presentations. MAPOG’s versatility makes it suitable for a wide range of use cases — from real estate project mapping and travel itineraries to educational storytelling, infrastructure planning, field surveys, and even political campaign management. In short, MAPOG brings together data visualization, collaboration, and decision-making on one simple, intelligent platform. It empowers users to not just see data — but to interact with it, understand it, and act on it. MAPOG – Where Data Finds Direction.
Featured Today

tiun
Payments backend for indie hackers
All-in-one: Auth, payments & DB
Single command: MCP, Skills
Built for developers.
Merchant of Record. Better fees.
The Weekly Top 10 in your inbox
Best launches + founder deals.