This task can be performed using Git Wrapped
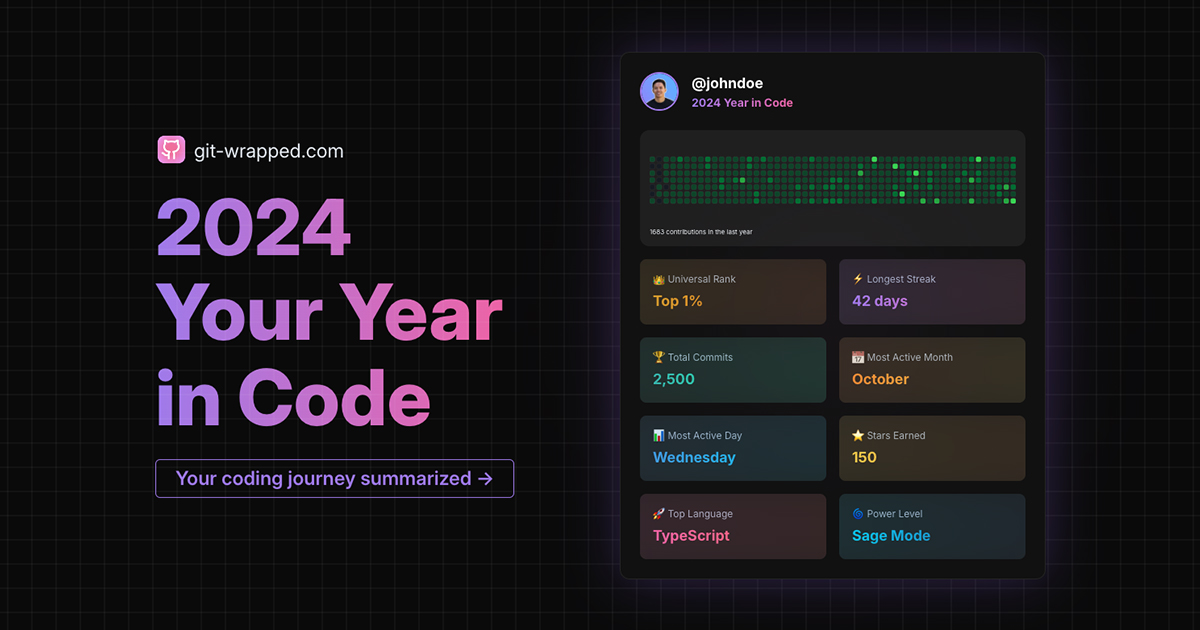
2024 Year in Code
Best product for this task
Git Wrapped
dev-tools
Like Spotify Wrapped, but for your GitHub activity! Discover your coding journey in 2024 with beautiful visualizations ✨ See your top languages, commit streaks, most productive days, and more in an engaging story format.
What to expect from an ideal product
- Shows your most-used coding languages with pretty charts and stats
- Displays your longest streak of daily code commits throughout the year
- Highlights which days of the week you code the most, perfect for spotting patterns
- Creates a story-like view of your coding activity, making it fun to share with others
- Turns boring GitHub stats into eye-catching visuals that are easy to understand
