This task can be performed using RightNow AI
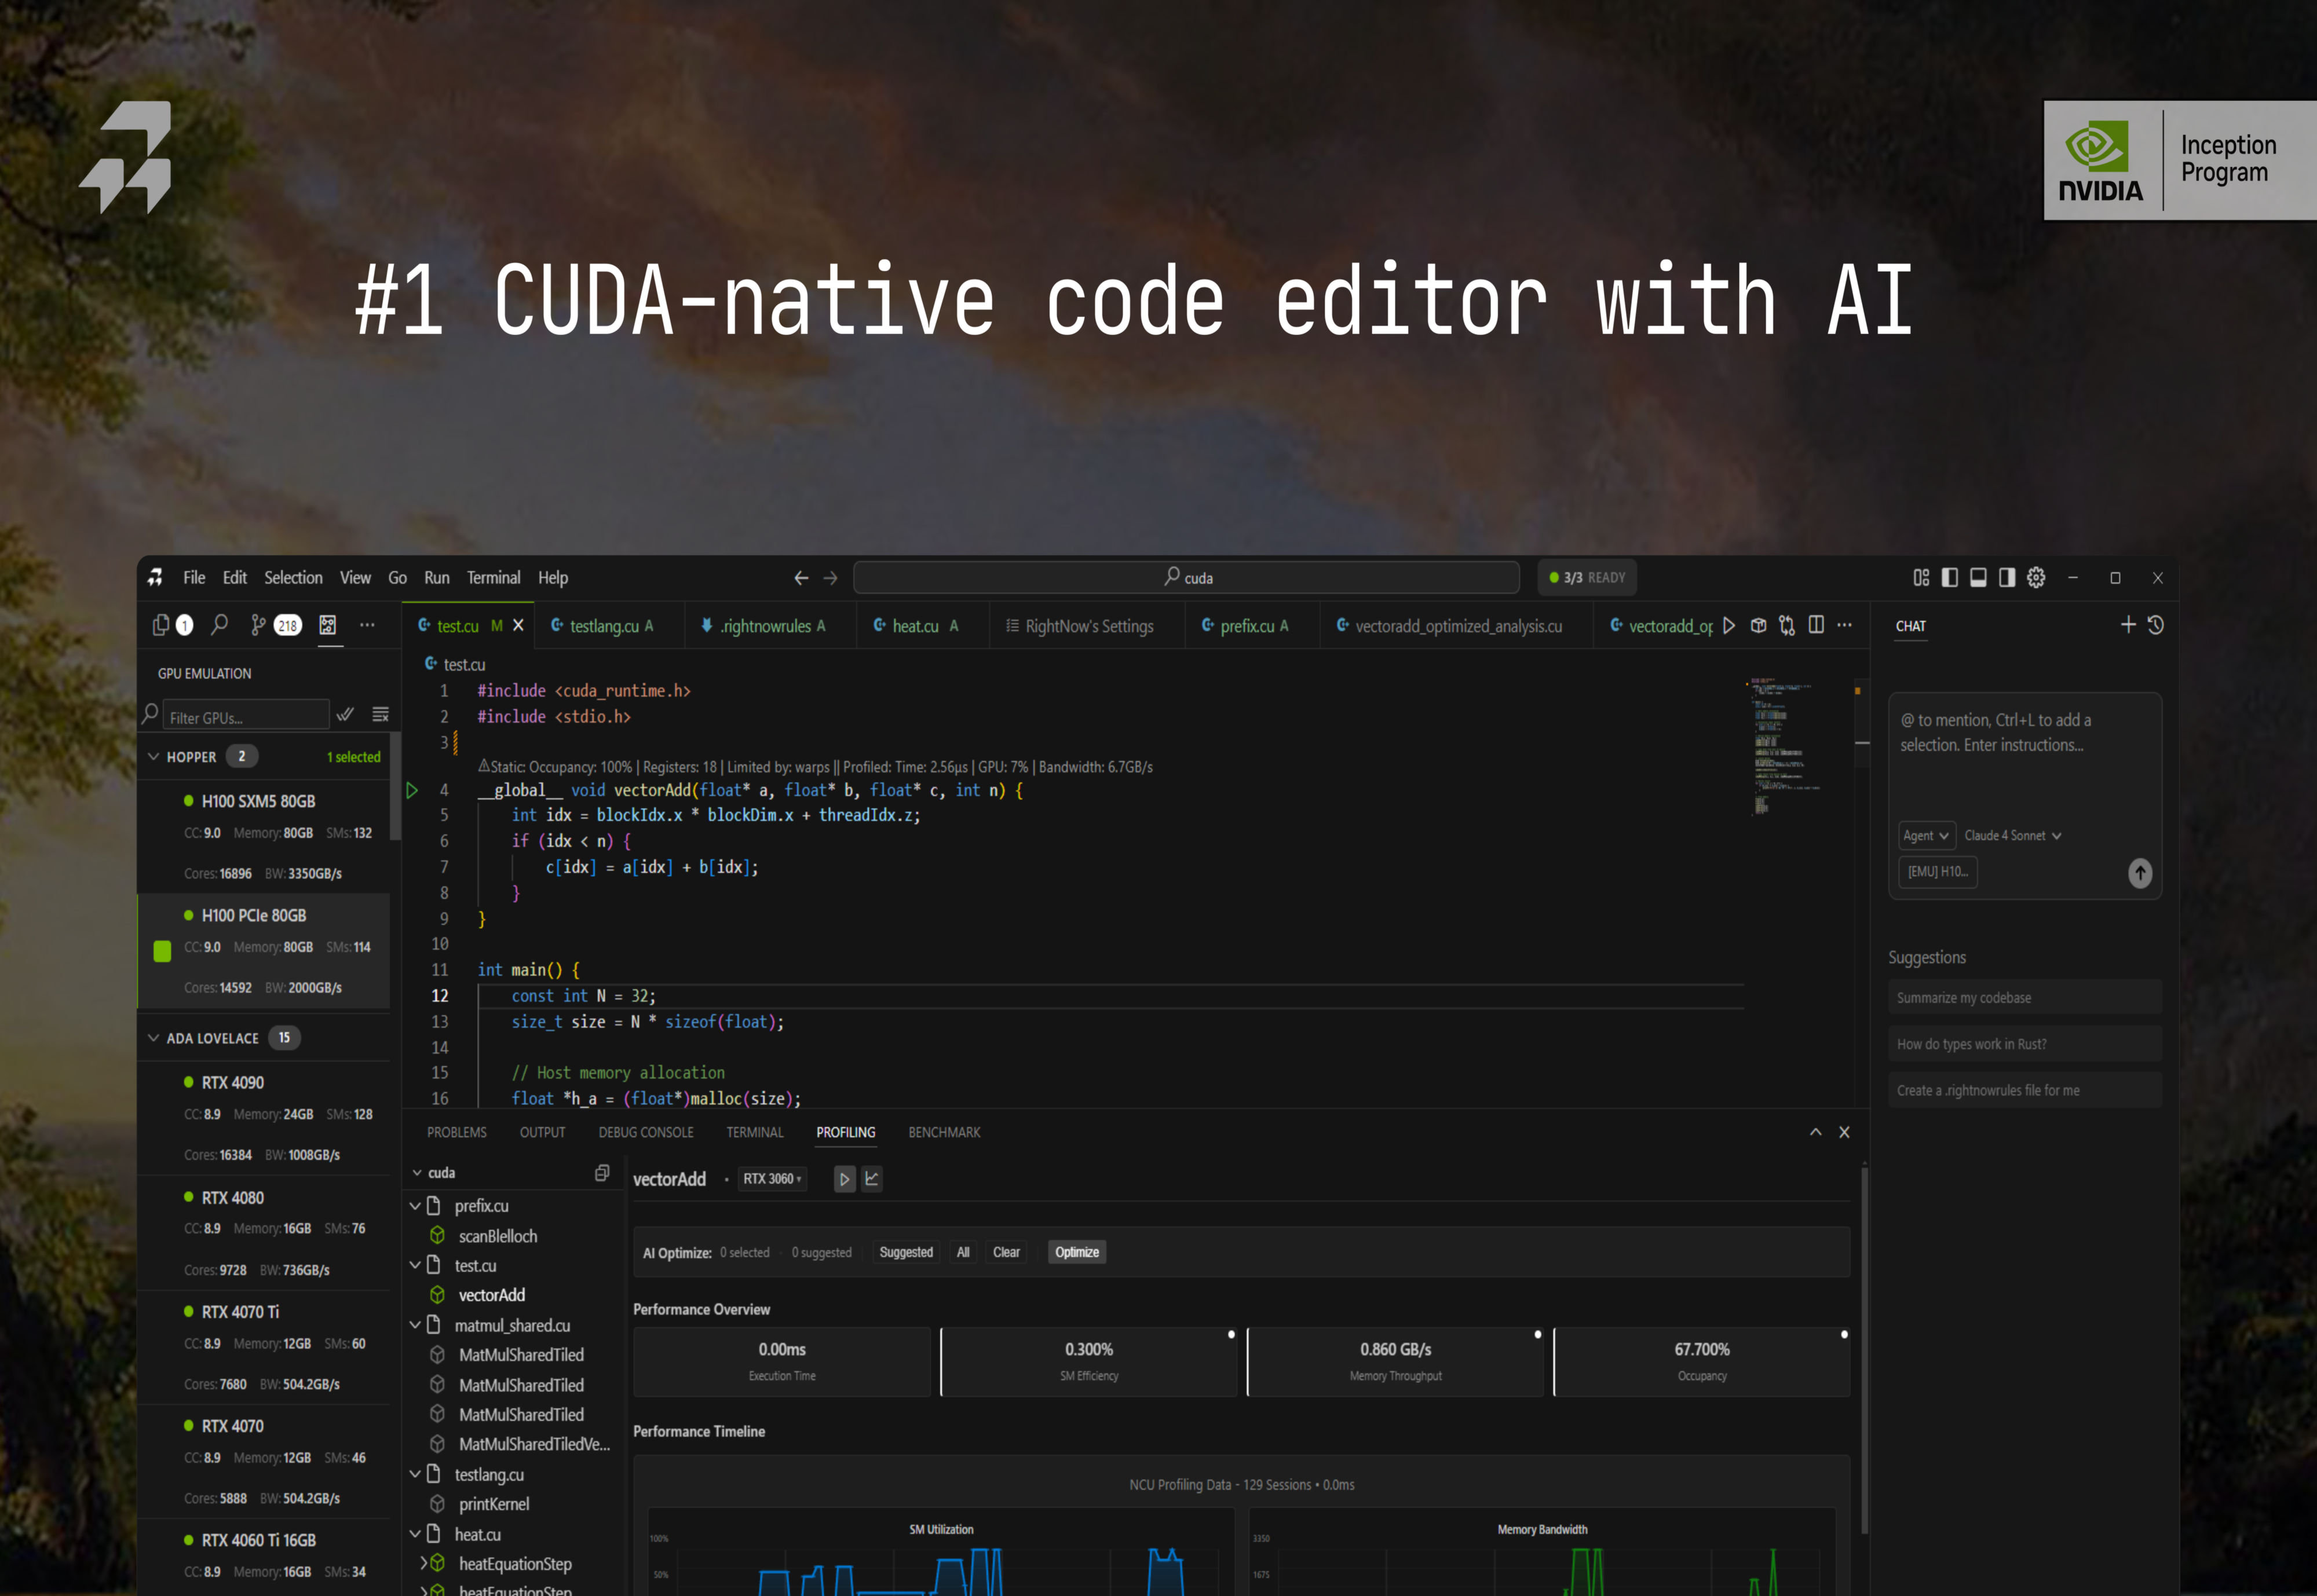
The first GPU-native code editor with AI
Best product for this task
RightNow AI
dev-tools
RightNow AI is the first CUDA-native code editor. It brings real-time GPU profiling, AI optimization, GPU virtualization, and a full emulator into one environment, helping developers build faster and more efficient CUDA applications
What to expect from an ideal product
- RightNow AI shows live GPU memory usage, execution times, and bottlenecks directly in the editor as you type your CUDA code
- The built-in profiler updates performance metrics instantly when you make changes, so you can see how each code modification affects GPU utilization
- You get visual charts and graphs of GPU performance data right next to your code, making it easy to spot problems without switching between tools
- The editor highlights slow parts of your code and suggests specific optimizations based on real GPU performance data it collects
- Everything runs in one window - no need to compile, run external profilers, or jump between different applications to check how your CUDA code performs
