This task can be performed using Bentogrid
Create stunning bento grids effortlessly
Best product for this task
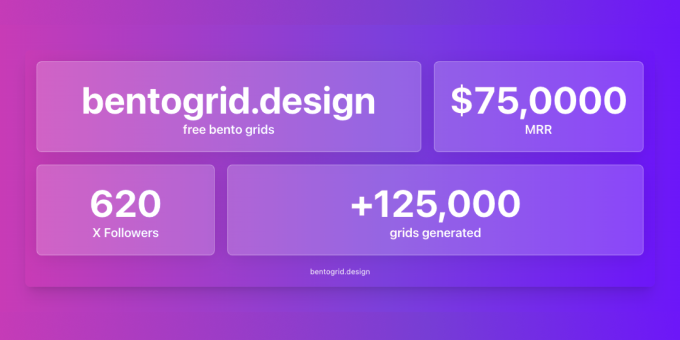
Bentogrid
social-tools
Generate bento grids to share your startup's most important info - stats, features, ++
What to expect from an ideal product
- Create visually appealing grids that highlight your key statistics.
- Easily customize the layout to match your startup’s branding.
- Share essential information quickly and efficiently.
- Use dynamic elements to keep your audience engaged.
- Simplify complex data into easy-to-understand visuals.
