This task can be performed using Maple
Open-source observability made simple with unified OpenTelemetry insights
Best product for this task
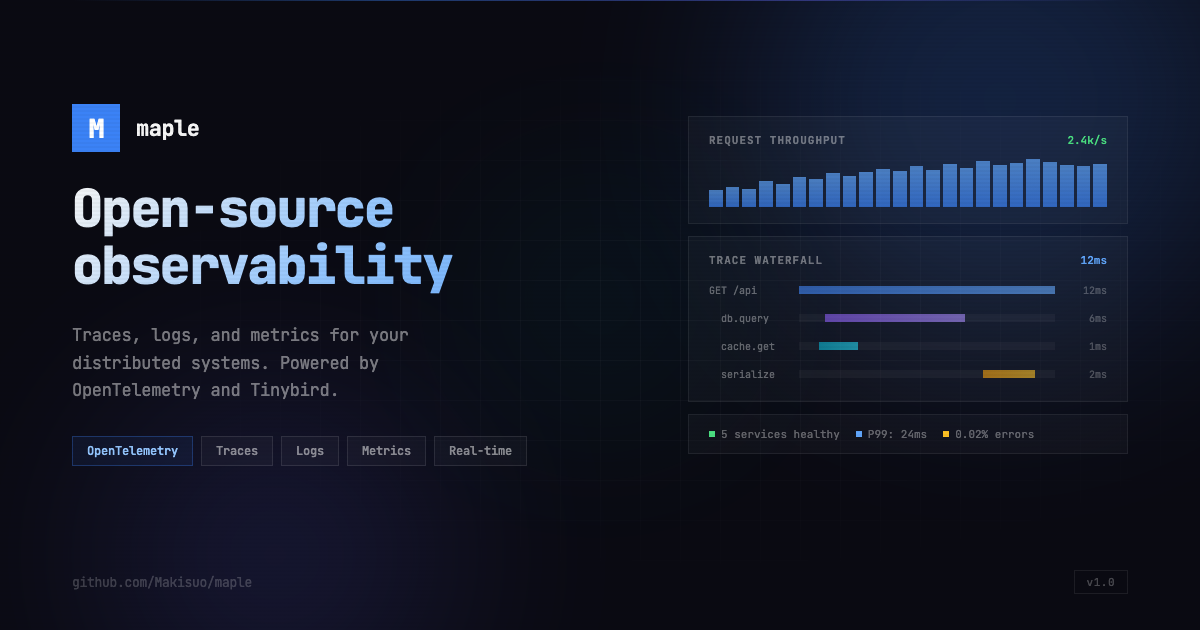
Maple
analytics
Maple is an OpenTelemetry-native observability stack that unifies traces, logs, and metrics with AI-assisted diagnostics. Engineering teams use it to debug microservices, investigate performance issues, and query massive telemetry datasets in milliseconds.
What to expect from an ideal product
- Maple's AI diagnostics automatically identify performance bottlenecks across your microservices by analyzing traces, logs, and metrics together instead of checking each data source separately
- The unified OpenTelemetry dashboard shows you exactly where slowdowns happen in your system with visual flame graphs and dependency maps that highlight problematic services
- Built-in anomaly detection spots unusual response times, error spikes, and resource consumption patterns before they impact users, sending alerts with suggested fixes
- Query your telemetry data in milliseconds to drill down from high-level performance trends to specific failed requests, comparing current issues with historical baselines
- Root cause analysis tools correlate errors across distributed traces to show you the exact code paths and database queries causing performance problems in your applications
