This task can be performed using Checkmate
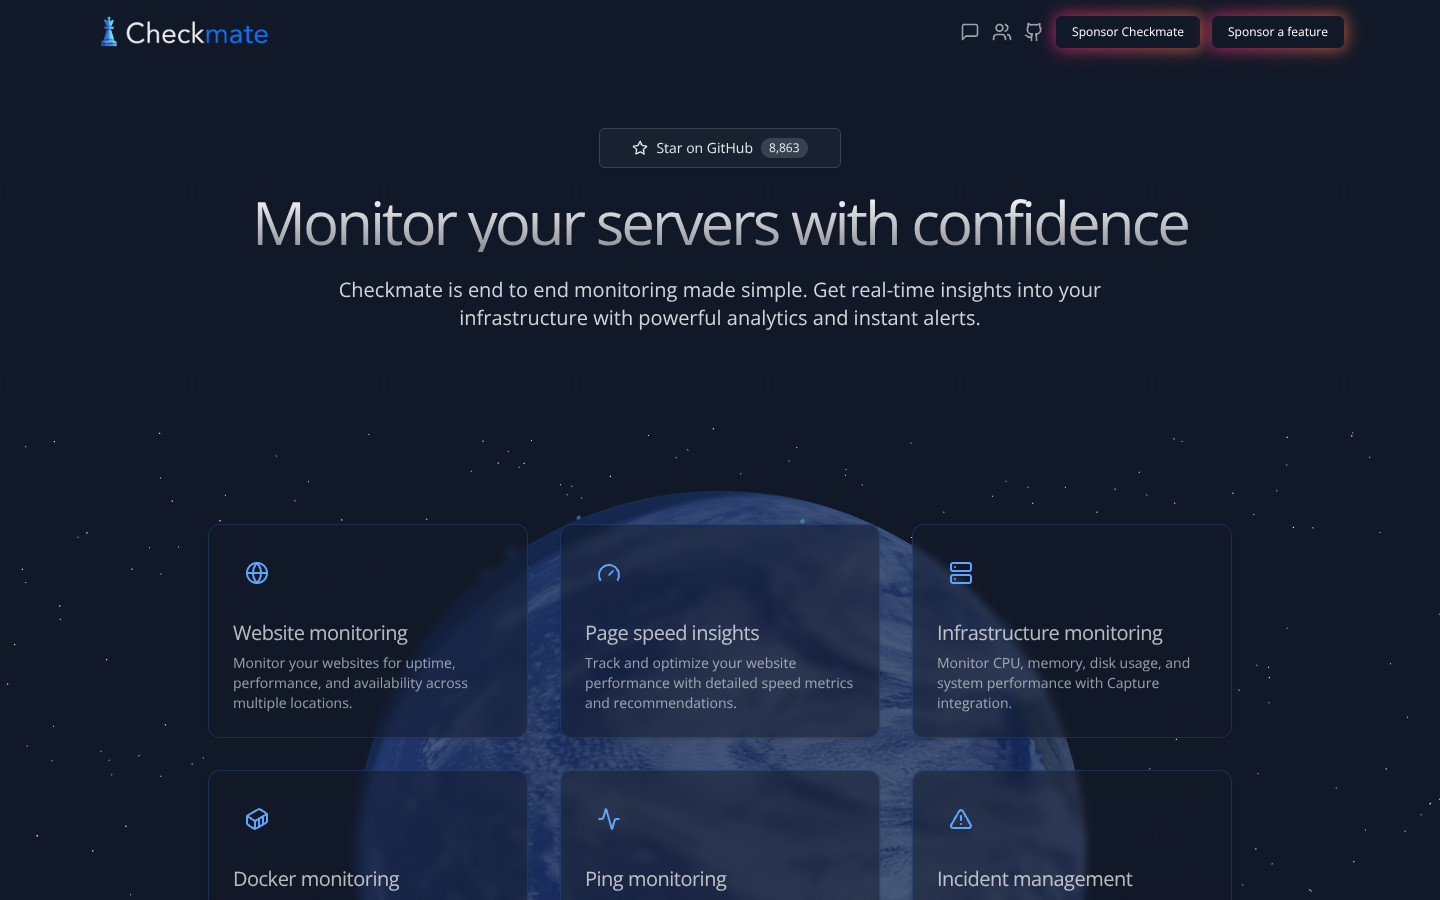
Checkmate: beautiful, blazing-fast, open source server monitoring
Best product for this task
Checkmate
oss
Checkmate is an open source server monitoring system that gives engineers fast, clear visibility into infrastructure health. It provides high-performance metrics collection, intuitive dashboards, and full control through a customizable, self-hostable codebase.
What to expect from an ideal product
- Checkmate offers drag-and-drop dashboard builders that let you arrange server metrics exactly how your team needs to see them
- Real-time data visualization shows CPU usage, memory consumption, disk space, and network traffic in clean charts that update instantly
- Custom alert thresholds can be set for any metric so you get notified when servers hit critical levels before downtime happens
- Multiple dashboard views let different team members focus on their specific infrastructure components without cluttering the interface
- Self-hosted deployment means you control all dashboard configurations and can modify the interface to match your monitoring workflow perfectly
