This task can be performed using LazyAnalysis
Making Collaborative Data Analysis and System Automation More Accessible
Best product for this task
LazyAnalysis
analytics
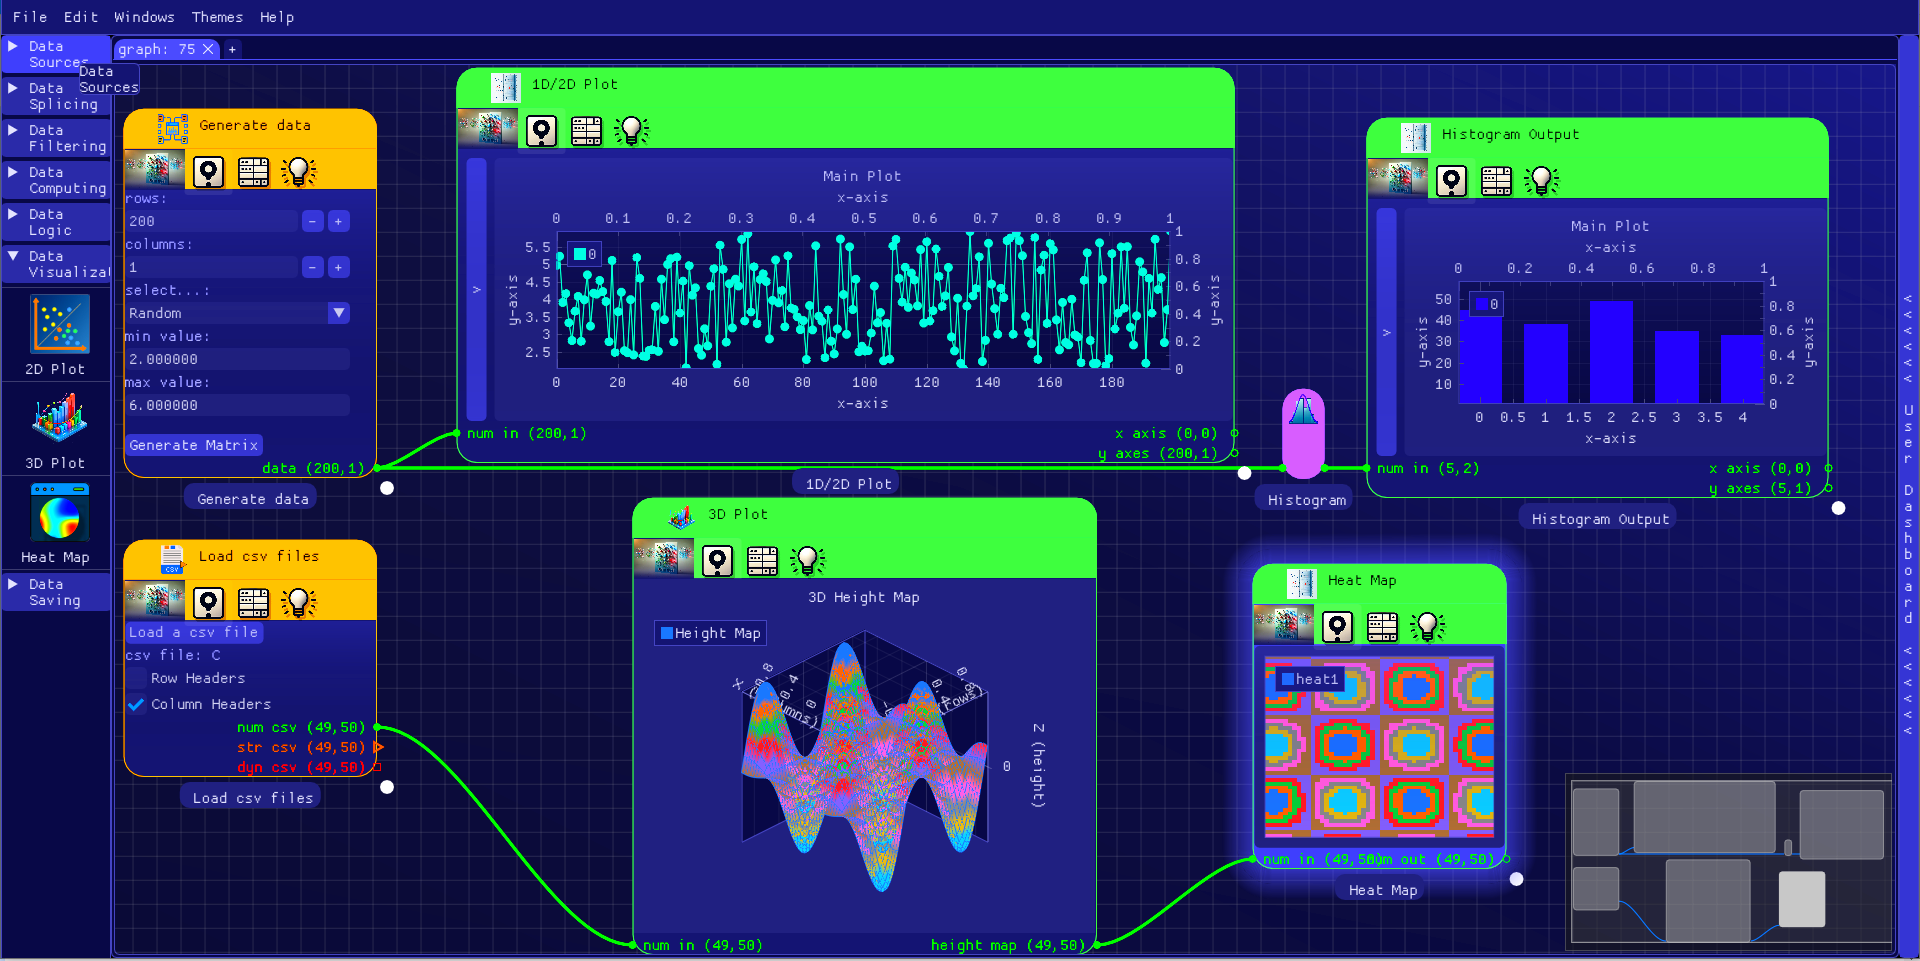
State of the art data and computation platform allowing business owners and analysts to unlock new insights from data and systems. Drag and drop nodes to connect, calculate, process and visualize data, and control systems and processes. The first major release in our pipeline allows users to create advanced data analysis pipelines. The upcoming releases include: Data Cleaning, Web Scraping, Real-time Data Acquisition/Sensor Fusion, Rest API integrations, and Stock Trading Analysis.
What to expect from an ideal product
- Drag and drop different data sources onto the dashboard and connect them with simple lines
- Mix data from spreadsheets, web sources, and live feeds in one clean view
- Build custom calculations between data sources without coding
- Create instant visualizations by dropping source connections into chart templates
- Save your data connections and layouts as reusable dashboard templates for future use
