This task can be performed using 8D Stock Chart
A new multidimensional way to analyze stocks
Best product for this task

8D Stock Chart
analytics
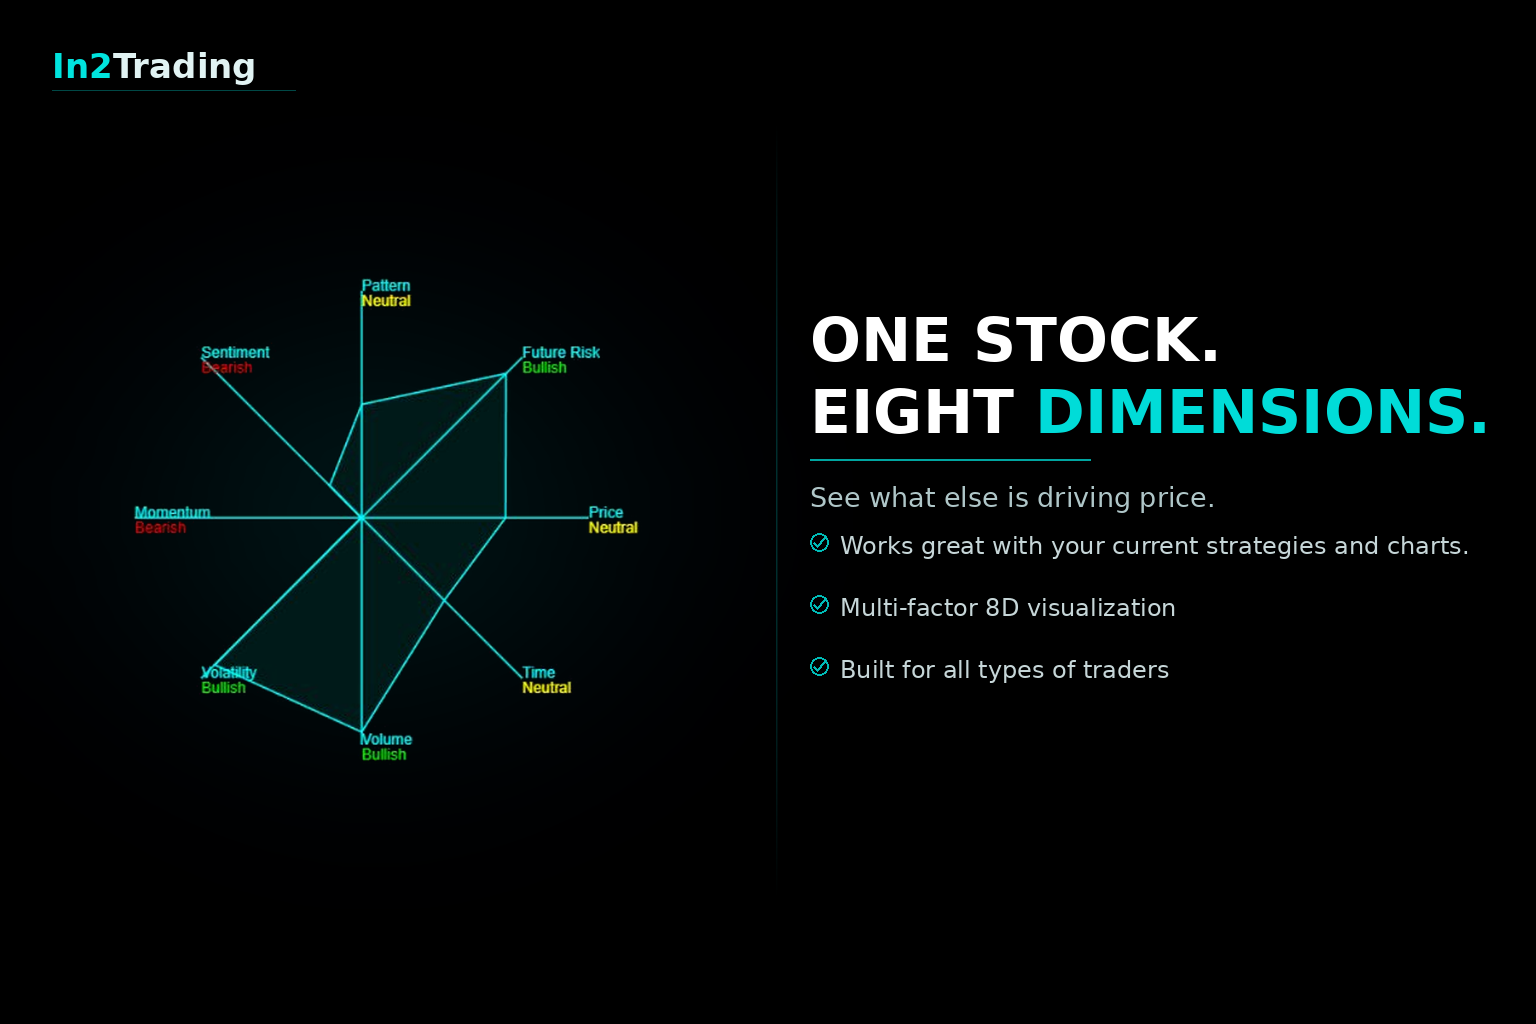
The 8D Stock Chart helps investors understand stocks faster by combining eight key market dimensions into a single visual framework. It integrates price, volume, volatility, sentiment, momentum, pattern behavior, time factors, and future risk into one structured view, helping users evaluate market context more efficiently than traditional single-indicator analysis. Designed as a decision-support tool or on its own, it complements existing charting platforms by providing multidimensional insight at a glance.
stock analysistechnical analysistrading toolsmarket analysisdata visualizationfintechinvestingstock researchtrading strategy
What to expect from an ideal product
- The 8D Stock Chart layers eight market dimensions into one view so you stop switching between five separate indicators just to read basic market context.
- Investors using traditional charting platforms can plug 8D Stock Chart in as a decision-support layer without rebuilding their existing workflow from scratch.
- Instead of guessing sentiment or momentum separately, the 8D Stock Chart surfaces both alongside price, volume, and volatility in a single structured snapshot.
- Multidimensional stock analysis used to mean hours of manual cross-referencing, but the 8D Stock Chart compresses that process into one glanceable visual framework.
- Whether you trade daily or review positions weekly, the 8D Stock Chart factors in time-based signals and future risk so your analysis reflects the full market picture, not just price action.