Rankings hub: What’s on the page now.
TTM and MRQ company leaderboards, curated market-cap peer sets, long-horizon and daily price stats, and country GDP—now grouped into four clear sections and refreshed daily.
May 3, 2026
Rankings Hub: What's on the Page Now
TickerLeague's Rankings Hub has been reorganized into a clearer, story-driven experience that guides users from company fundamentals to market behavior and macroeconomic context.
Instead of presenting rankings in a flat grid, the page now groups leaderboards into four structured sections, making it easier to explore companies from multiple perspectives and understand how financial metrics connect to broader market trends.
1. Across the Financial Statements
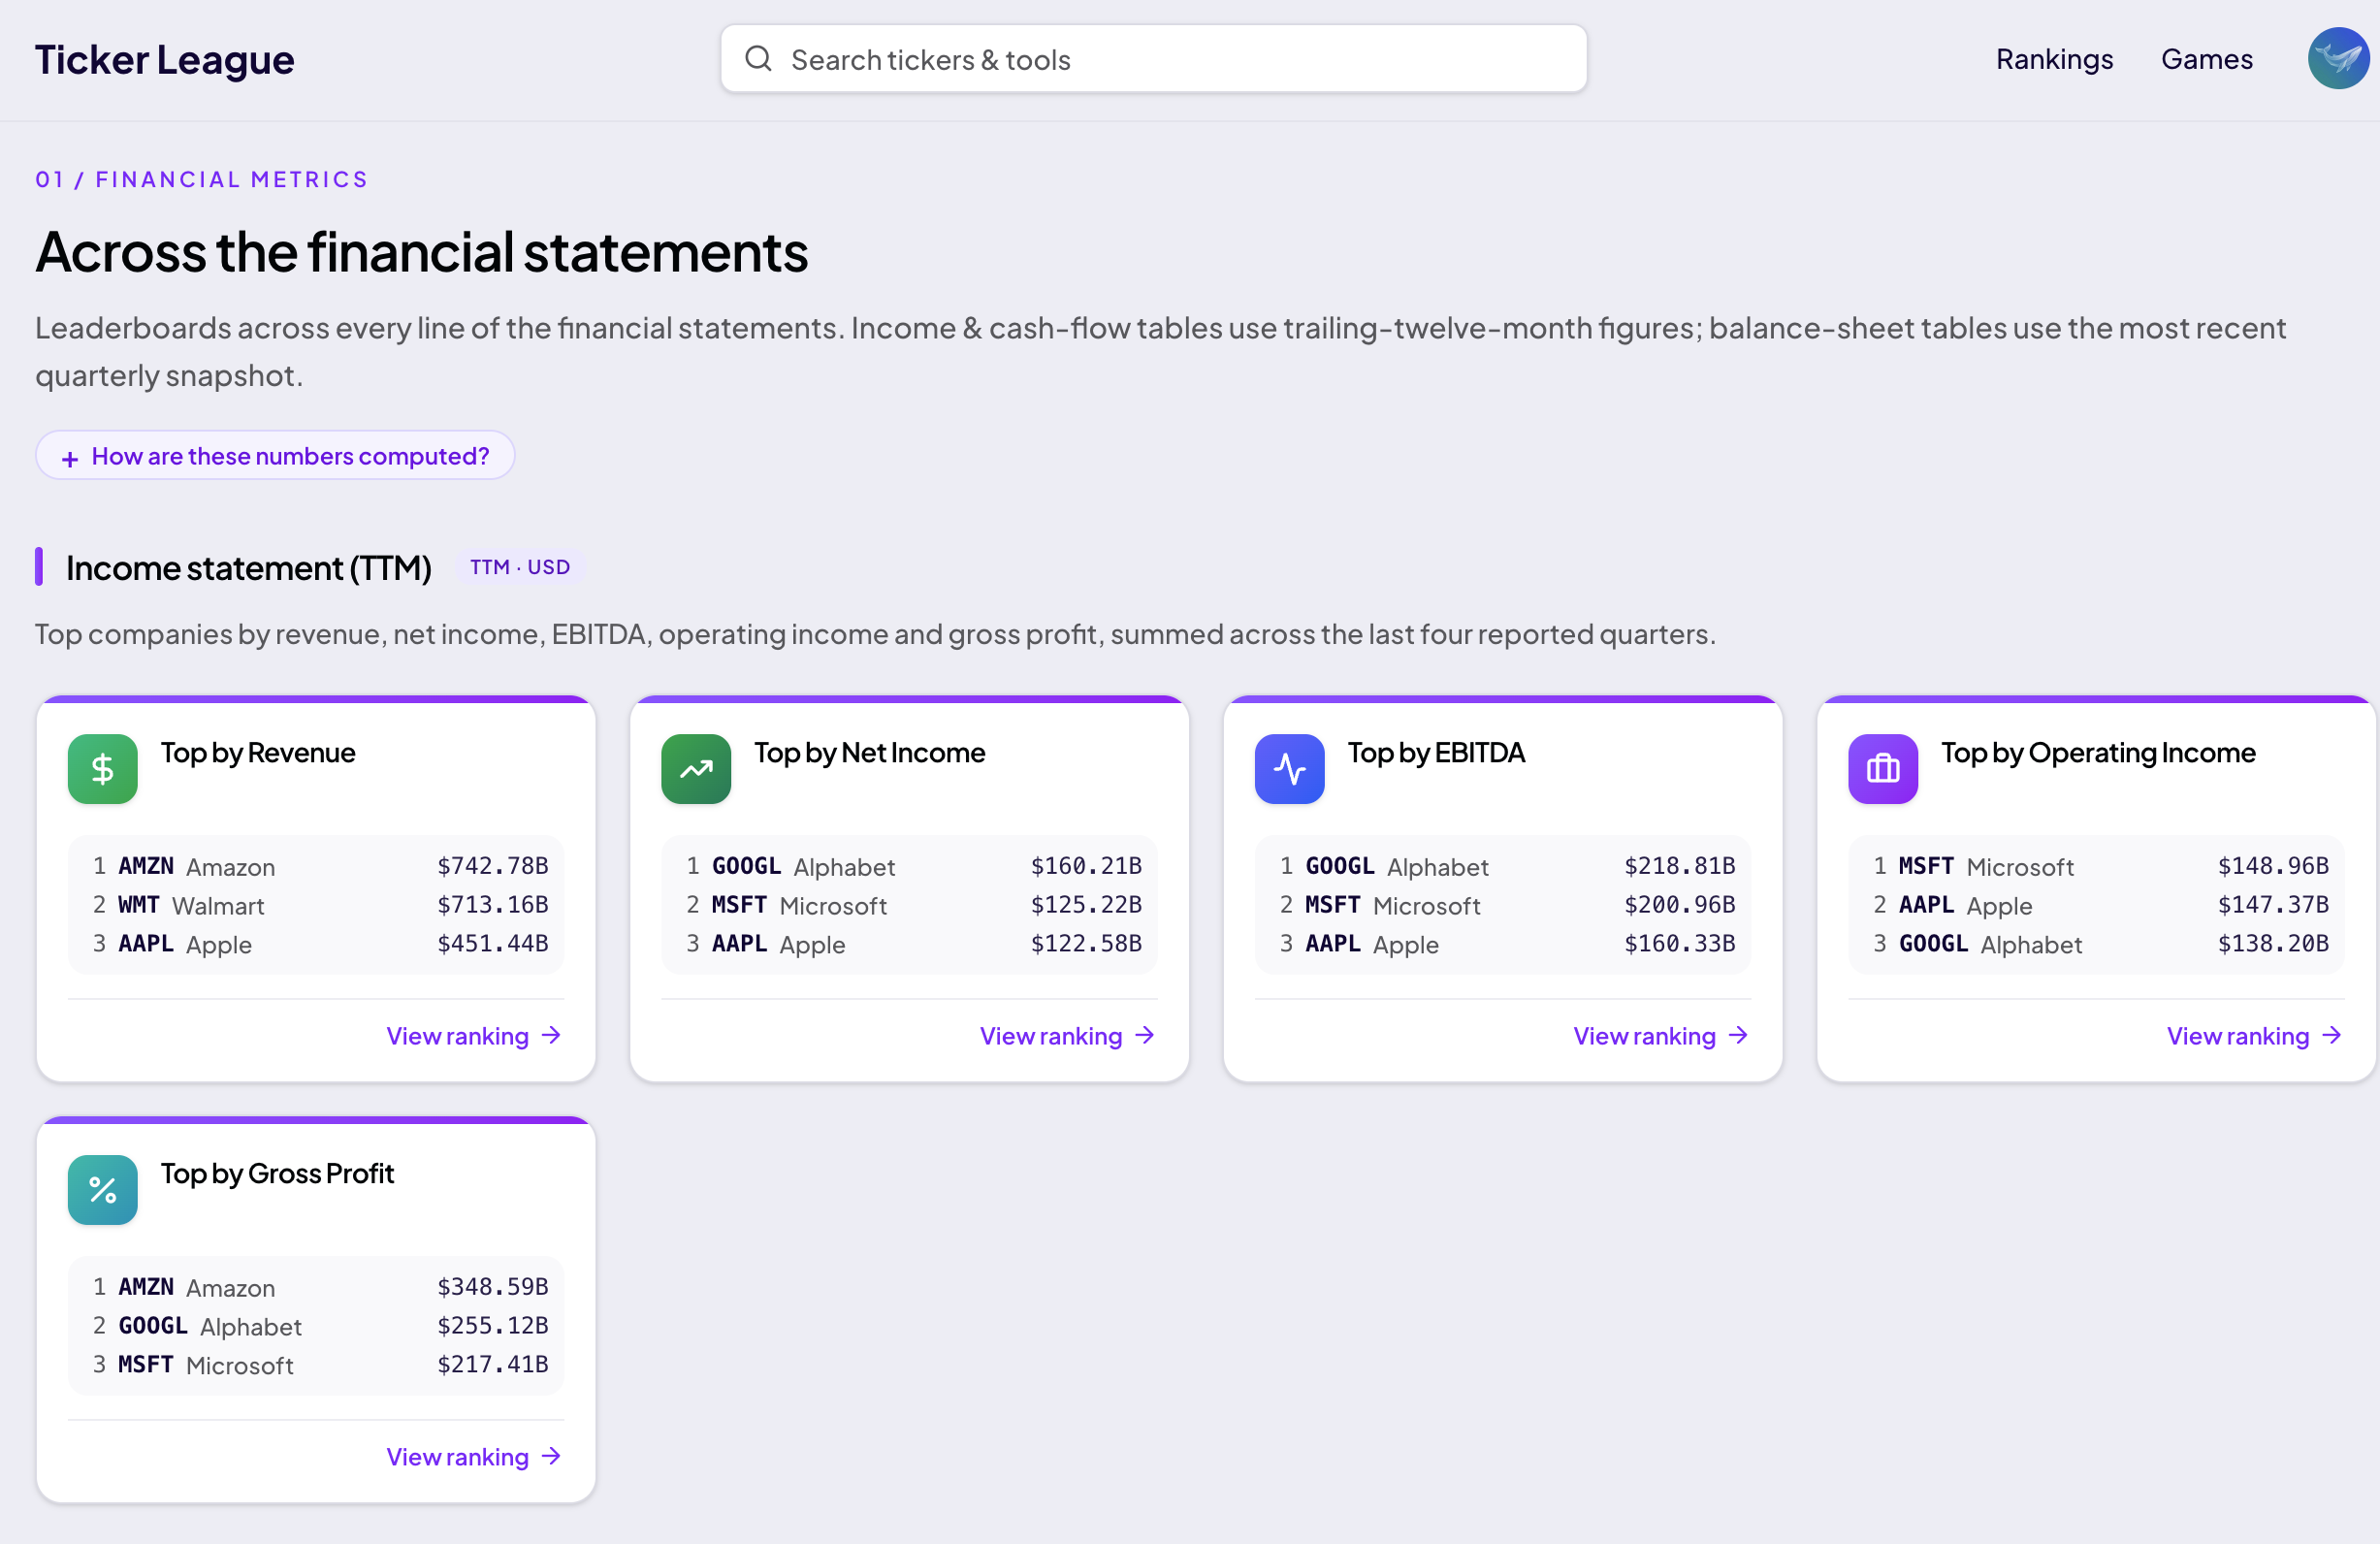
The first section focuses on company fundamentals and pulls every statement-metric ranking from a unified data registry.
Income Statement Rankings (TTM)
Trailing-twelve-month (TTM) income rankings include:
- Revenue
- Net income
- EBITDA
- Operating income
- Gross profit
Balance Sheet Rankings (MRQ)
Using the most recent quarter (MRQ), users can compare companies by:
- Total assets
- Total liabilities
- Total debt
- Cash on hand
- Stockholders' equity (net assets)
- Diluted shares outstanding
- Net cash
Cash Flow Rankings (TTM)
Cash flow metrics include:
- Capital expenditures
- Free cash flow
- Stock-based compensation
Capital Return Rankings
Investors can also explore shareholder-return metrics such as:
- Buybacks
- Dividends paid
- Buyback yield
- Shareholder yield
Market Value & Profitability
This section also includes:
- Overall market-cap rankings
- The trillion-dollar club
- Profitability rankings
The profitability page allows users to sort large public companies by:
- Gross margin
- Operating margin
- EBITDA margin
- Net margin
- Free-cash-flow margin
All profitability metrics are based on trailing-twelve-month data.
2. Sector and Industry Market-Cap Rankings
The second section focuses on peer comparisons.
Rather than comparing unrelated businesses, TickerLeague groups companies into curated sector and industry lists where market-cap comparisons are more meaningful.
Current categories include:
- U.S. oil and gas companies
- U.S. restaurant chains
- Pharmaceutical companies
- U.S. airlines
This structure makes it easier to understand relative size within a specific industry.
3. Stock Performance and Daily Market Behavior
The third section combines long-term returns with short-term trading behavior.
Long-Term Return Rankings
These rankings highlight:
- Maximum historical return (best buy-and-sell path)
- Total return from IPO to present
- Cumulative stock-split multipliers
Daily Price Behavior
Users can also explore behavioral market statistics, including:
- Current winning and losing streaks
- Longest historical winning streaks
- Historical win rates (percentage of up days)
Where applicable, calculations use dividend-adjusted closing prices across:
- Stocks
- ETFs
- Market indices
This section helps investors understand both long-term wealth creation and day-to-day market patterns.
4. Macro Scale and Economic Context
The final section expands beyond individual companies and markets.
Countries are ranked by GDP, creating a macroeconomic benchmark that can be viewed alongside corporate revenue and market-cap leaderboards.
By placing national economies next to public-company rankings, users gain additional context on the scale of businesses relative to entire countries.
Data Methodology and Refresh Cycles
Throughout the Rankings Hub, TickerLeague distinguishes between different types of financial data:
- TTM (Trailing Twelve Months) for flow-based metrics such as revenue and earnings
- MRQ (Most Recent Quarter) for balance-sheet snapshots
- Live market capitalization for market-driven rankings
Market-sensitive datasets are refreshed daily, helping ensure rankings stay current and comparable.
Final Thoughts
The redesigned Rankings Hub transforms a collection of financial leaderboards into a structured research experience.
By organizing rankings around financial statements, industry peers, market behavior, and macroeconomic context, TickerLeague makes it easier to move from raw numbers to meaningful comparisons and insights.
